Nexus Dashboard, or ND, runs microservice applications; one of which is the Fabric Controller. To get started with ND, you must first install the application. If you have experience with prior versions of ND, there is no need to start individual services now. ND's installation has already been performed for you in the interest of time so that you can focus on the automation and configuration aspects of ND via the northbound REST API.
In your browser, if ND is not already open, then open another instance of the browser or another tab. Copy the URL for Nexus Dashboard:
At the Nexus Dashboard login screen, log in using your username and password: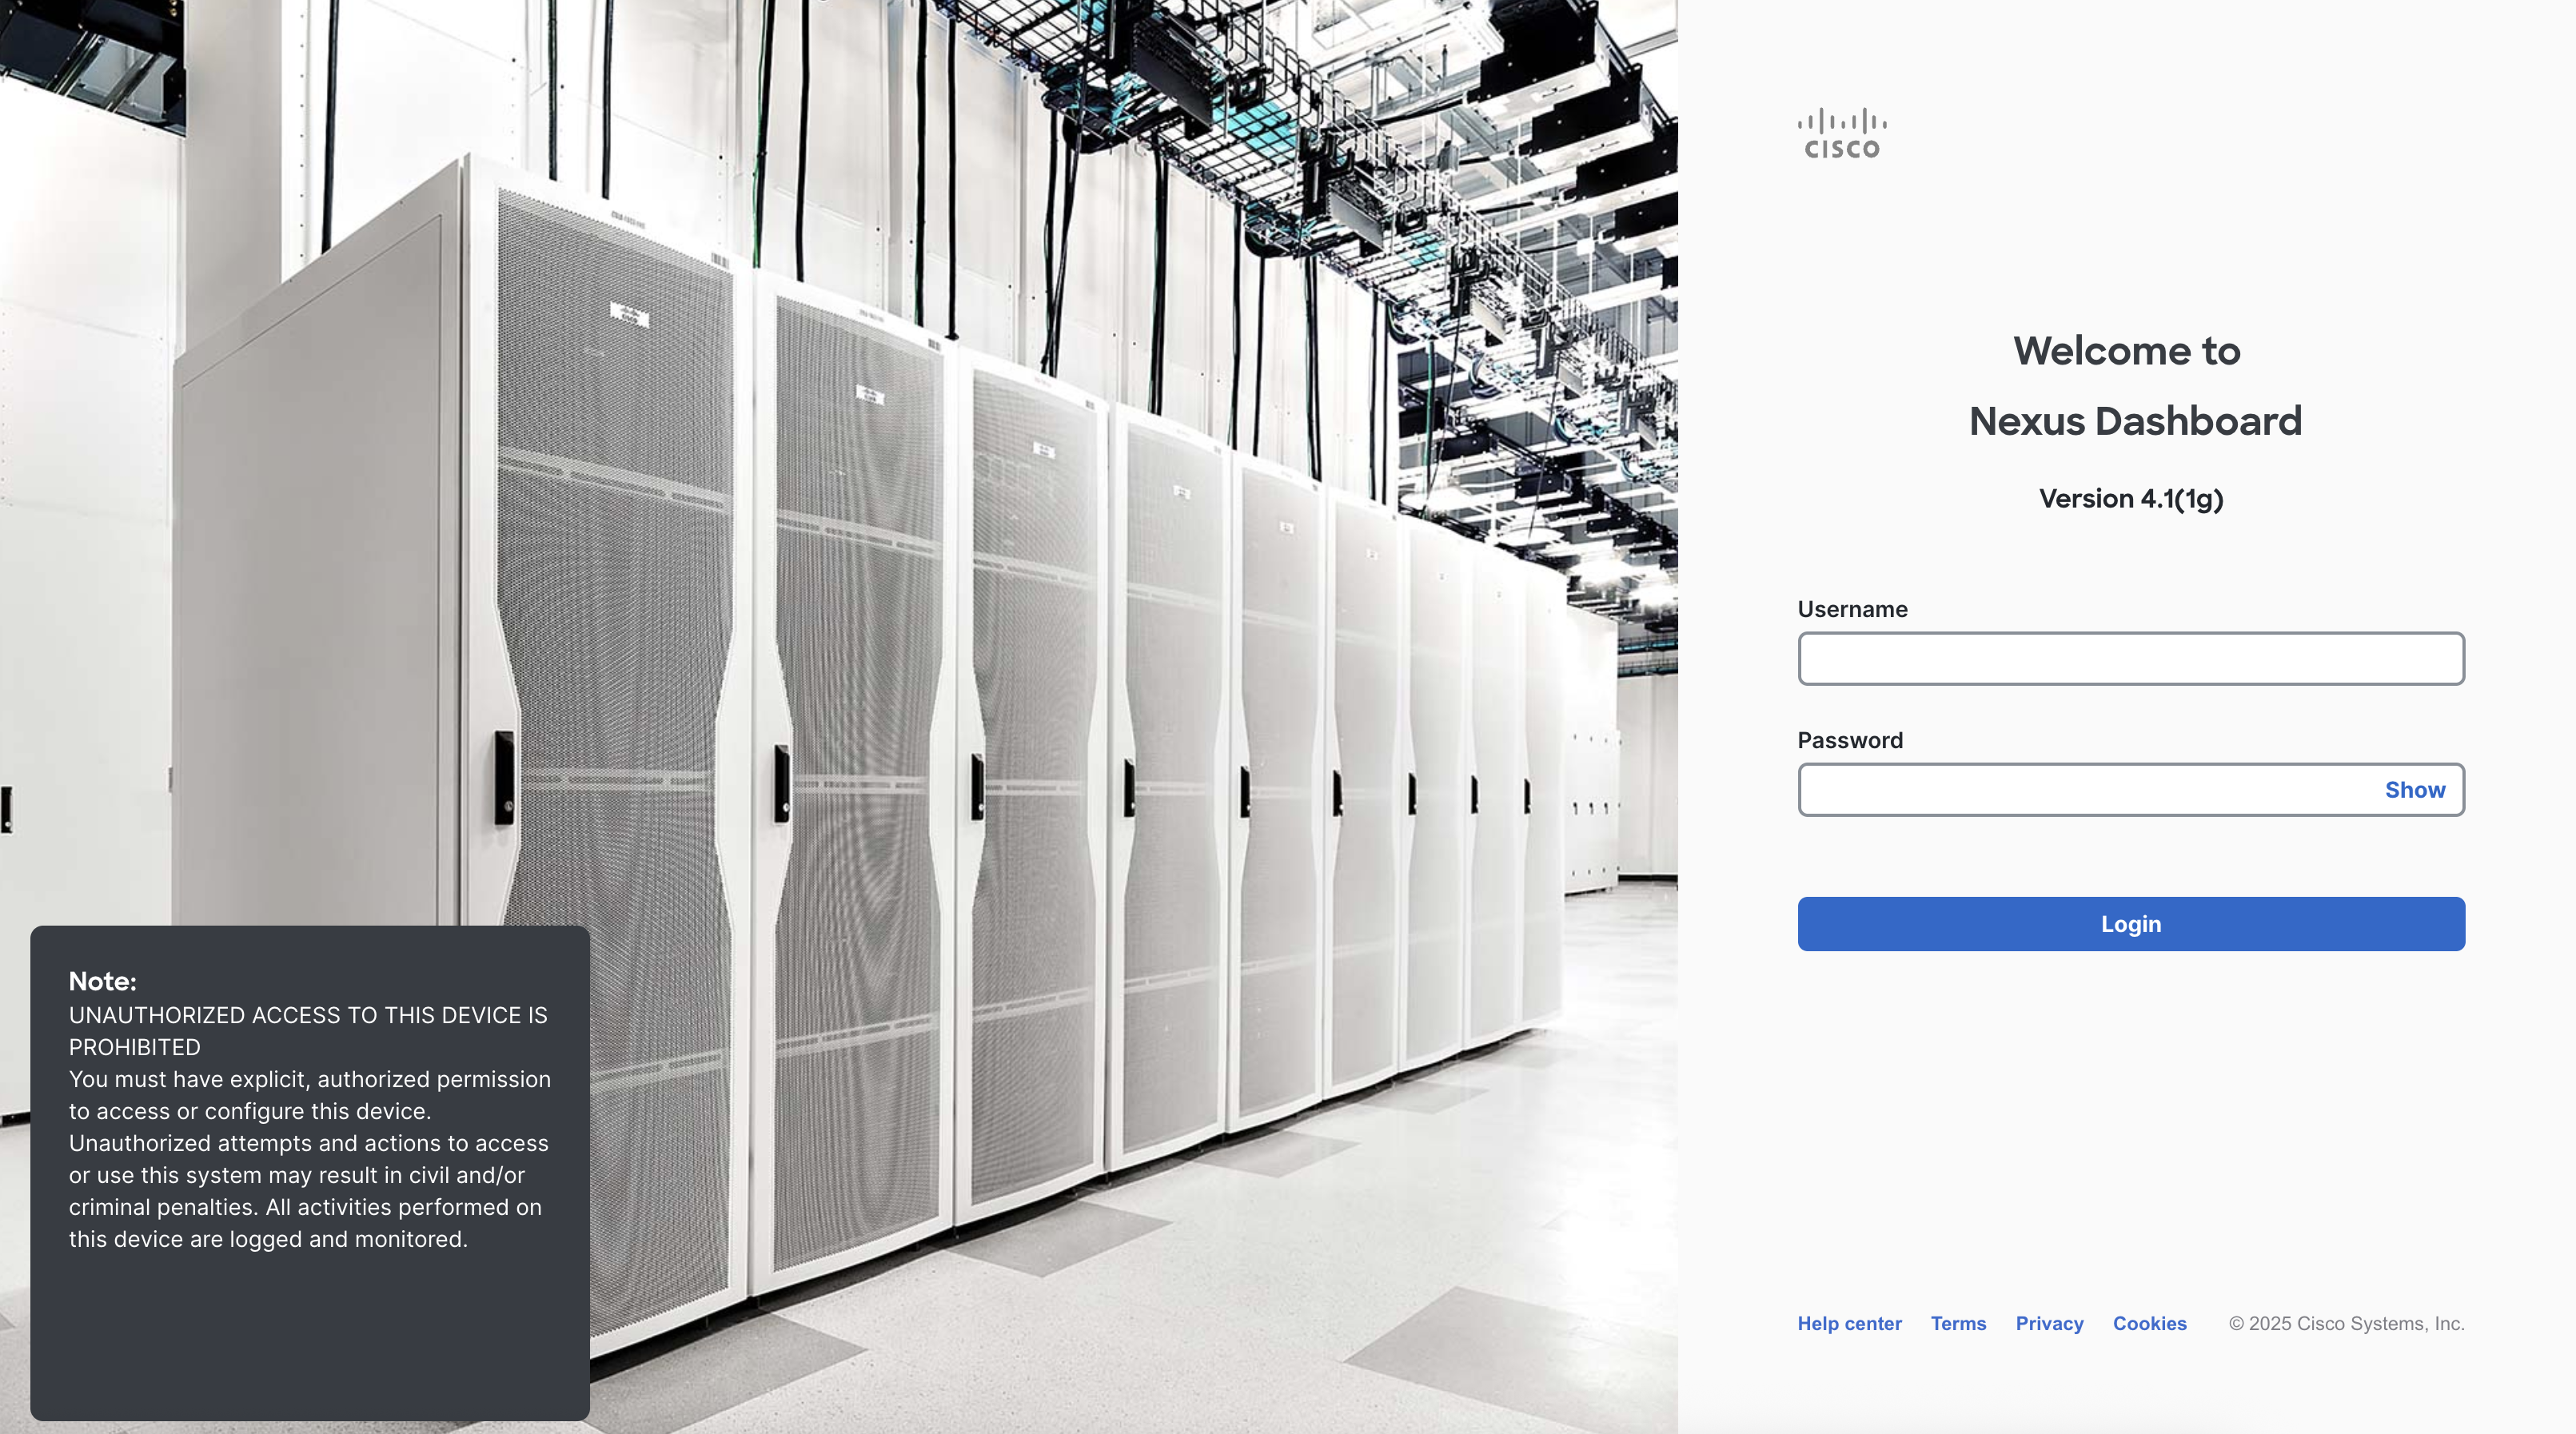
If there is a popup that appears, you can close it by clicking the Get started button.
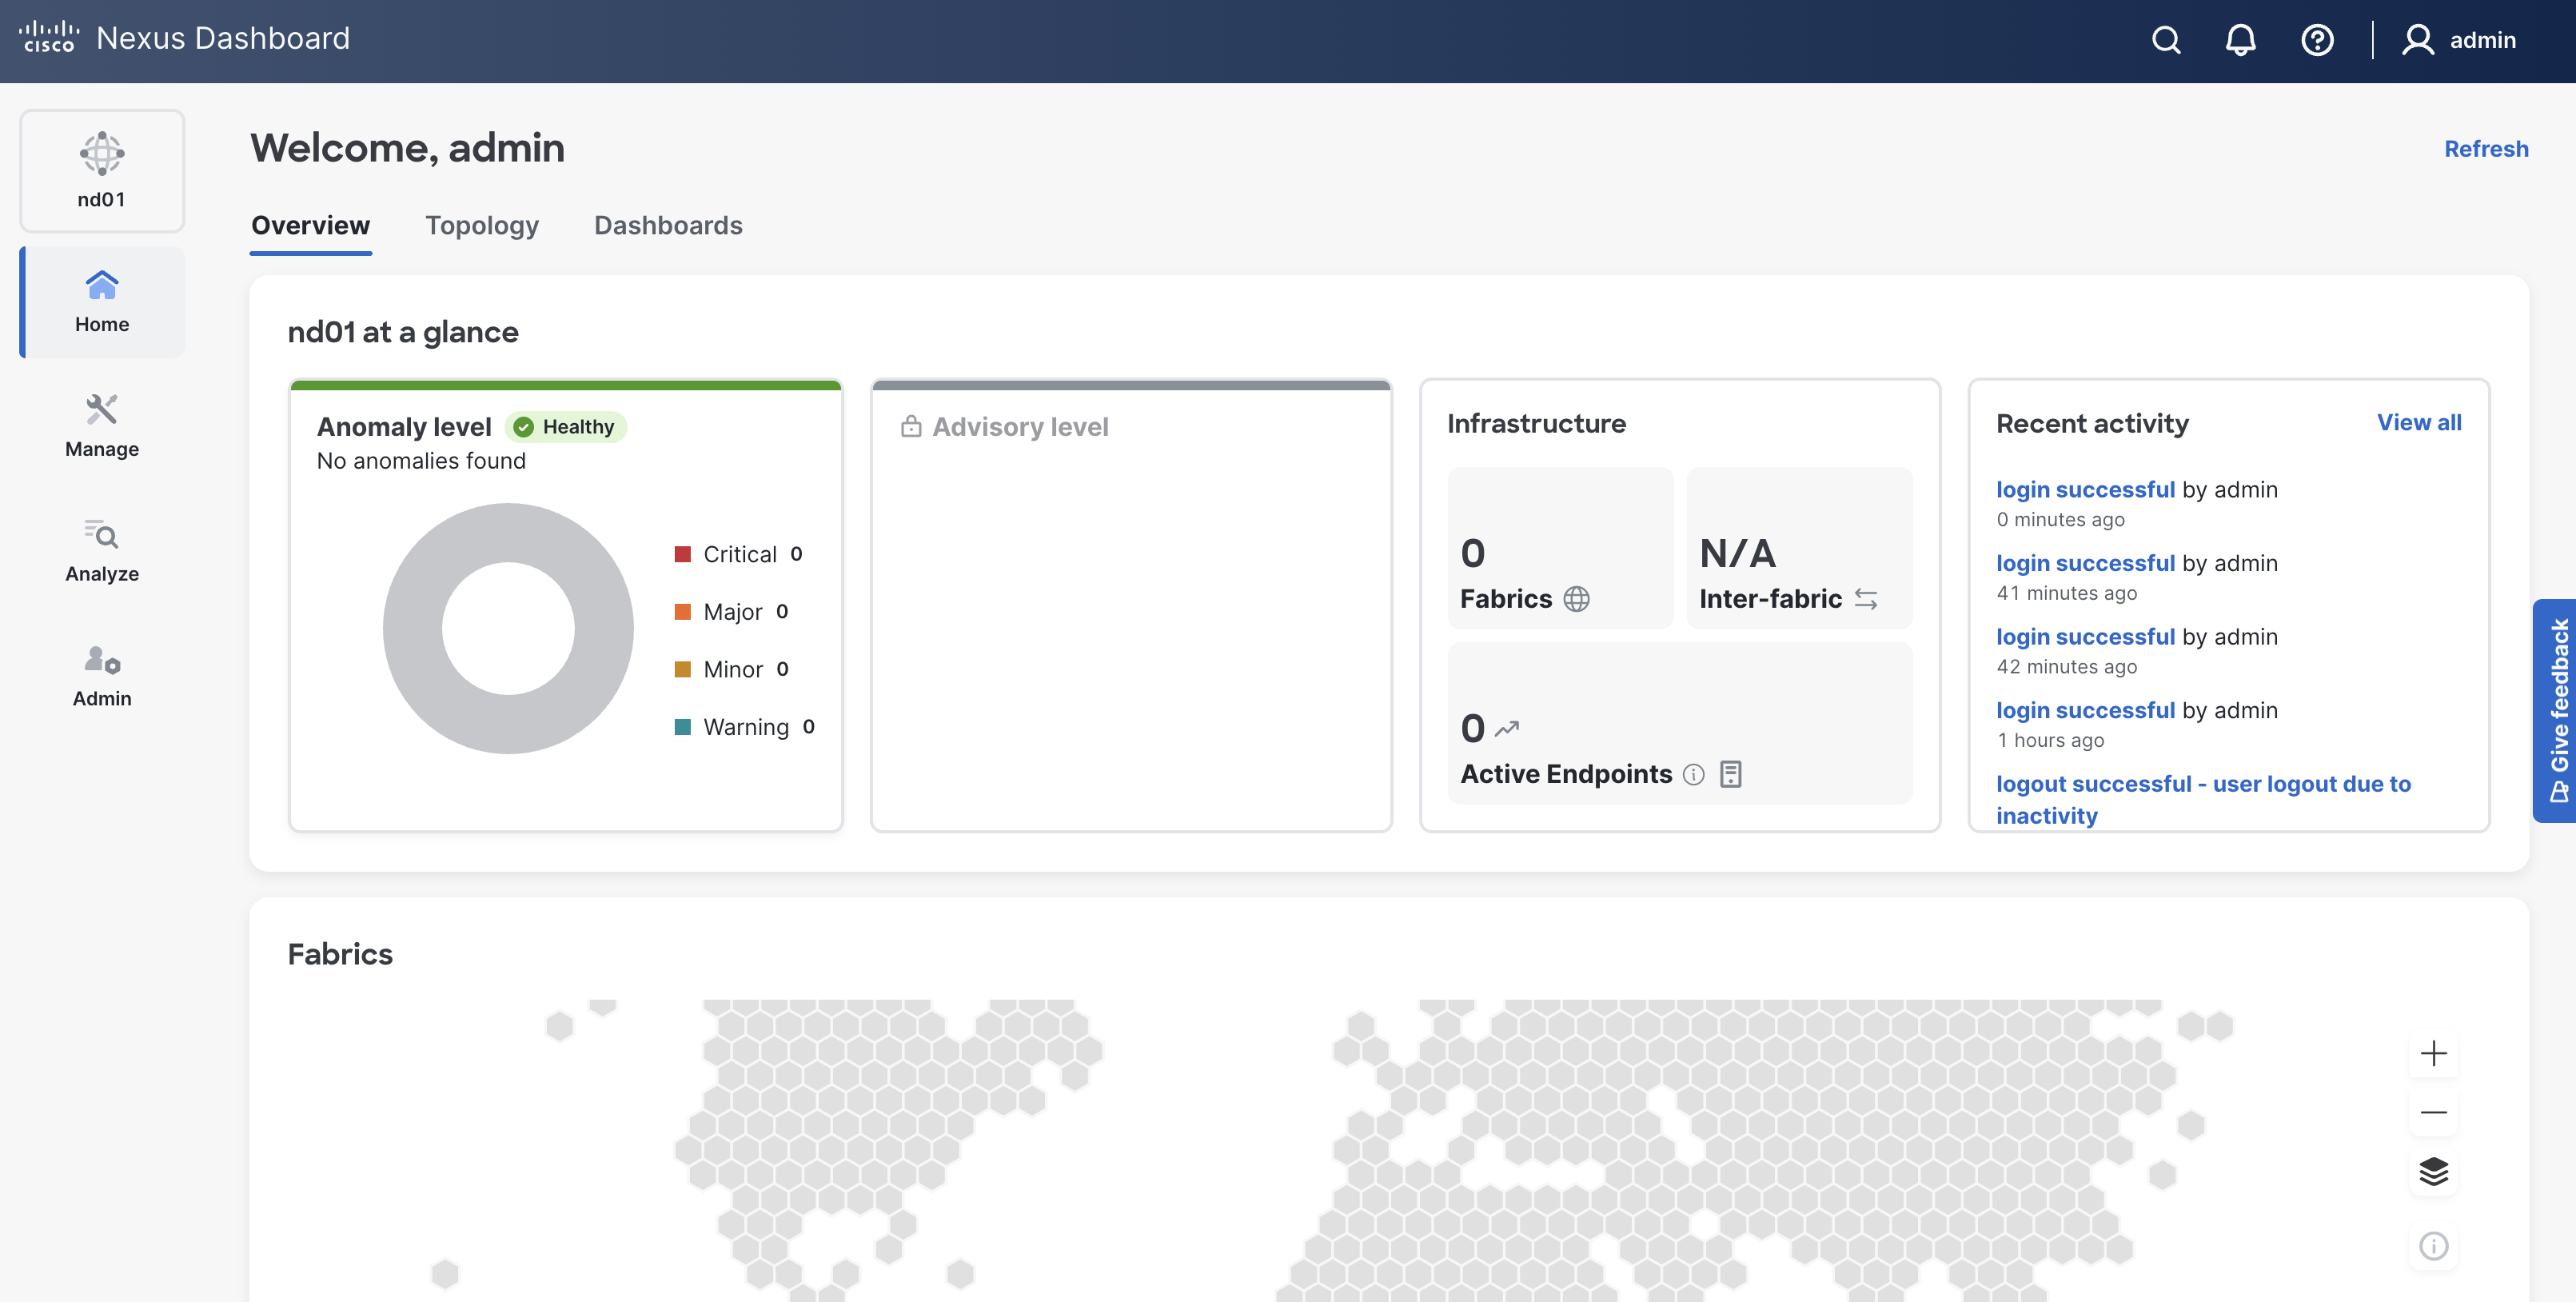
Once logged in, you will see the ND home dashboard. In a production environment, this page displays anomalies, advisories, fabric infrastructure details, and a recent activity log.
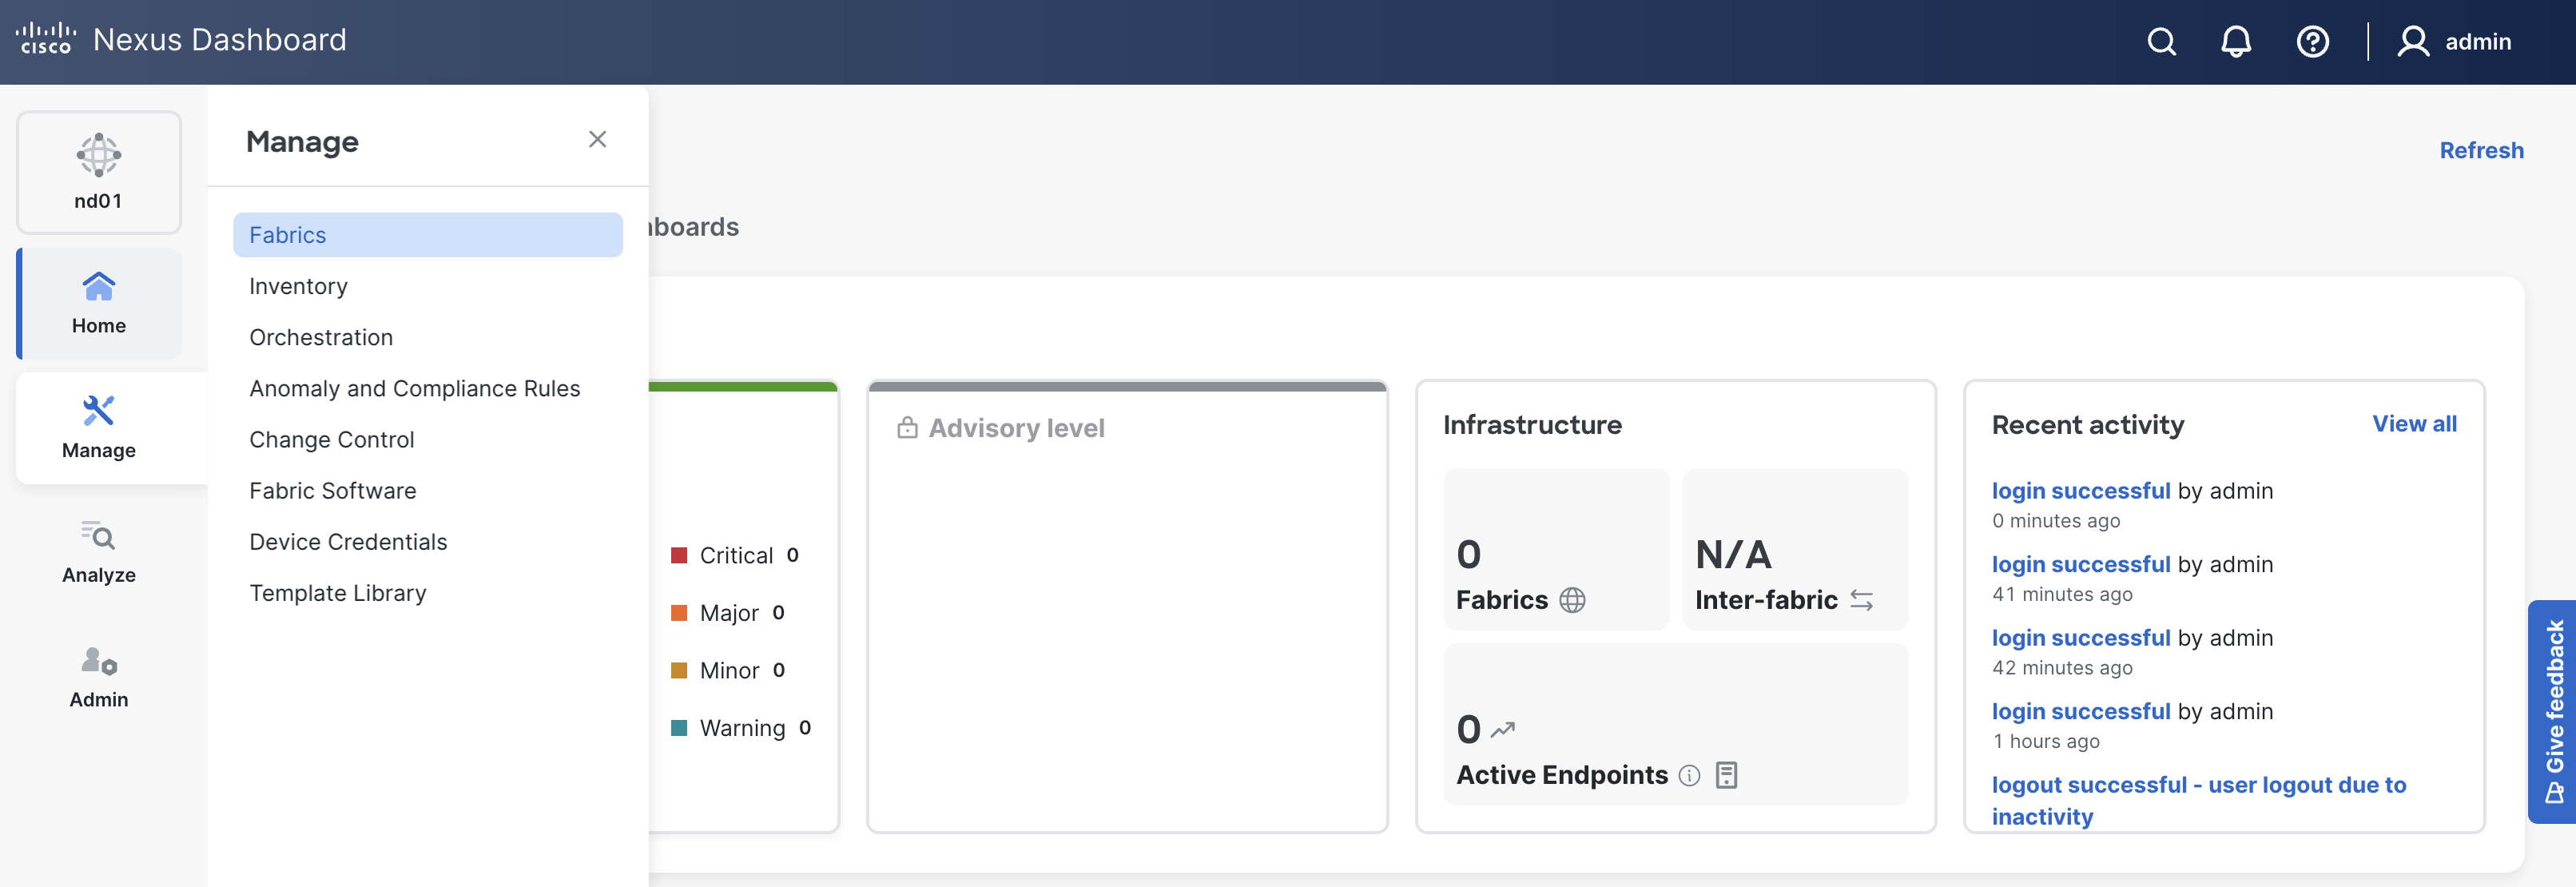
You will also see a navigation pane on the left side of the screen. For the purposes of this lab, you will only be using the Manage section of the navigation pane.
This lab makes use of a single-node virtual Nexus Dashboard (vND) app instance for lab purposes and consequently has limited telemetry and monitoring functionality.
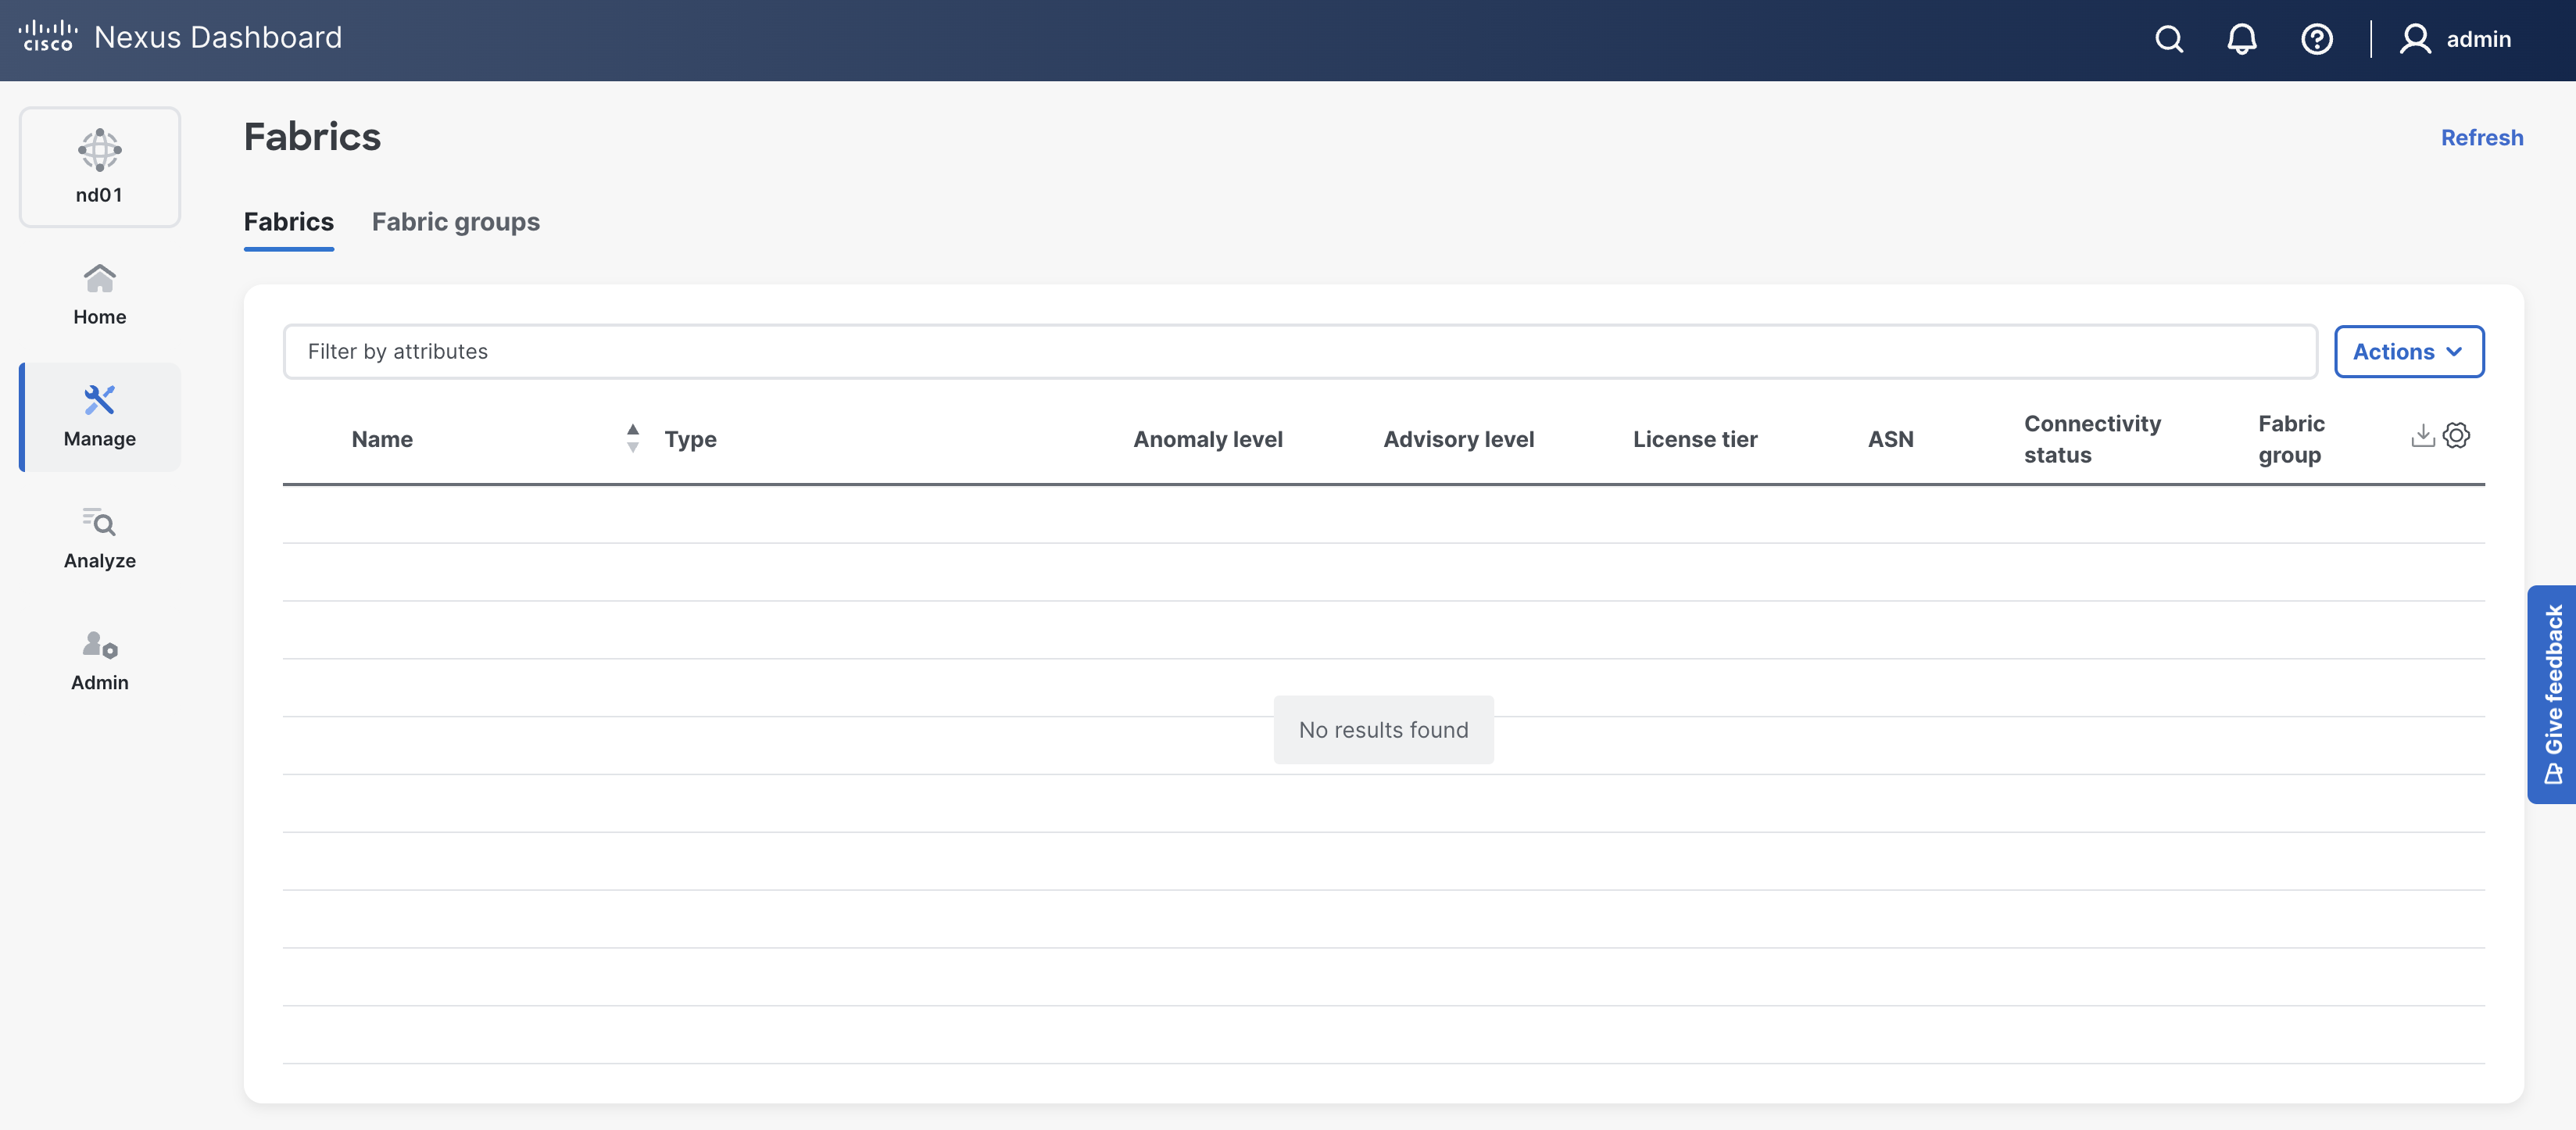
This lab guides you through populating and managing fabrics via local development and CI/CD pipelines, which will appear here:
ND automation follows the same steps as the GUI but delivers faster, more reliable network configuration workflows!
Continue to the next section to get started working with Nexus Dashboard (ND) programmatically.